Cross-cutting normal faults
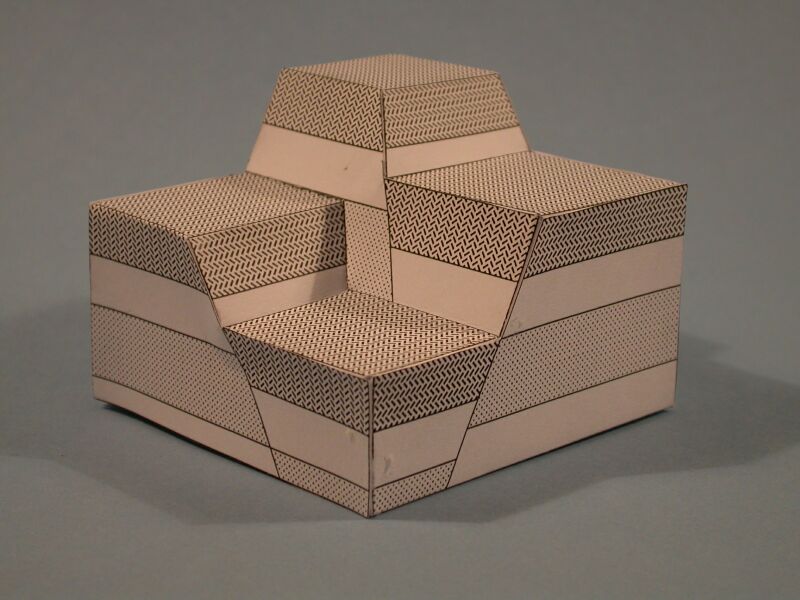
These models illustrate the geometrical consequences of two cross-cutting normal faults and the difficulty of interpreting the timing of cross-cutting normal faults from fault heave polygons on structure contour maps. The faults have different dips and displacements. The fault heave polygon map for the top horizon of Part I appears to show fault A being offset by fault B. The models show that this interpretation is incorrect. The fact that Fault B pre-dates fault A is highlighted on the sub-horizontal map view generated by combining Part I and Part II; Part I and II ideally (if the paper is not too thick) fit together and you can assemble them to a cube. Exercises associated with these models could include: (1) Draw a fault polygon map for the uppermost horizon of Part I. (2) Draw a map of the top surface of the combined model. (3) Discuss the apparent displacements and the relative timing of faulting in both cases. (4) If the stippled units are sandstone aquifers, in what way does the cross-cutting relationship of the faults either enhance or diminish fluid flow connectivity between these sandstones?
This is the most difficult of our models to build. Using our suggestions on how to build it, it should not however take any more than 30 minutes (we think!).
BACK
|