Abstract - The interpretation of fault kinematics from geometric data is an essential step in developing an understanding of the growth of fault systems. Constraints on fault geometry are, however, often restricted to 2-D maps or cross-sections. Analysis of well constrained 3-D fault geometries from outcrop, mine and 3-D seismic datasets provides a means of assessing the extent to which kinematic interpretations of faulting benefit from a 3-D geometrical perspective. Concentrating on relay zones and segmented normal fault arrays, we suggest that very different interpretations of their evolution arise from the recognition that rarely will the propagation directions of faults, and fault segments, be contained within the inspection plane of 2-D, map or cross-sectional, data. A 3-D perspective favours the initiation and 3-D propagation of many such arrays as kinematically coherent systems in which individual segments may even link into a single fault surface out of the plane of inspection. We argue that this model, which conflicts with the often suggested model of incidental overlap of originally isolated faults (Fig.1), should be the preferred model for the generation and growth of segmented normal fault arrays.
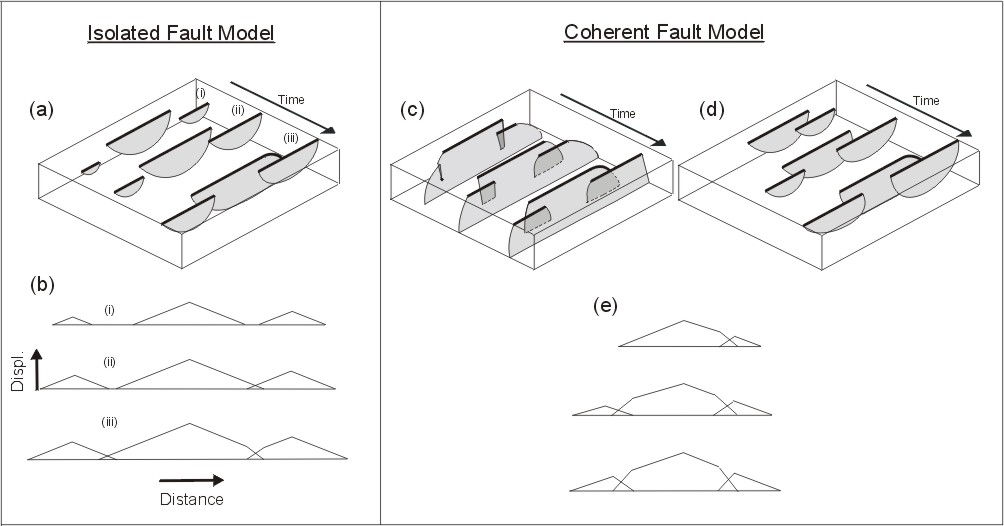
Fig. 1. Schematic illustrations of the two end-member models of formation of segmented fault arrays. The block diagrams (a, c and d) each show three stages in the growth of a segmented fault array (i - iii). The displacement-distance plots (b and e) are for the fault traces on the upper surfaces of the block diagrams (bold lines). The coherent fault model is illustrated for segmented fault traces that are (c) hard-linked and formed by fault surface bifurcation and (d) soft-linked and formed by 3-D segmentation. The aggregate displacement profiles (not shown) for the two models differ in that the points of maximum displacement are preserved where the faults were initially isolated (b - iii) but a simple aggregate profile occurs at all stages of development in the coherent fault model.
Abstract of talk given to:
Tectonic Studies Group Annual Meeting, Tectonic Studies Group, Liverpool, January 2003