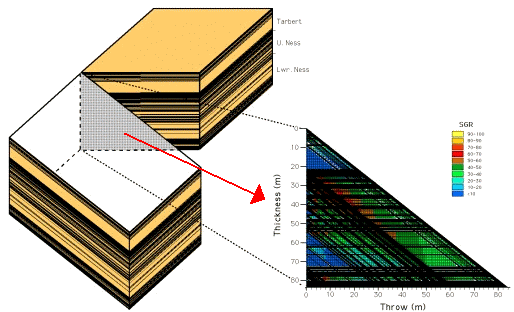
Triangle is software for "quick-look" fault seal analysis using well logs, jointly developed by the Fault Analysis Group and Badley Geoscience. Fault seal prediction requires knowing both lithology and fault displacement. For 'layer-cake' stratigraphy, triangle plots can provide a quick look approach to fault seal analysis. The diagram below shows how triangle plots work.

1 A synthetic fault is constructed by simply sliding the well log stratigraphy past itself and computing sealing based on an appropriate equation. In the diagram above the upthrown side of the synthetic fault is shown as a block with horizontal beds. The downthrown side of the fault is shown as a block dipping to the right. The grey area indicates where the two blocks are in contact across the fault. The throw (vertical offset) on the fault increases linearly from zero at the left (the fault tip) until the illustrated beds are completely offset at the right edge of the diagram.
2 The triangle diagram in corresponds to the grey area (redarrow above). Upthrown beds are shown as horizontal lines, downthrown beds as diagonal lines. The various triangular and parallelogram areas represent the variety of bed juxtapositions on the fault surface. Juxtapositions that correspond to sand-sand contact are colour-coded according to their fault-seal potential, in this case Shale Gouge Ratio. Triangle can calculate fault-seal potential using a variety of algorithms employed in industry.
3 Use a reservoir structure map to find which portions of each fault have throws which correspond to the sealing predictions of the triangle plot.
Triangle plots can also be used to rapidly test sensitivities to different throws, stratigraphy and Vshale content in areas of poor data quality and/or limited well data. The fault-seal 'triangle diagram' was first published by Bentley & Barry (1991) as a clay smear 'type panel' and was more recently developed by Knipe (1997) as a 'juxtaposition diagram'. Childs et al. (1997) first published Triangle plots with shale gouge calculations, together with another related diagram, the connectivity plot, also produced by the program.
Triangle is now a module of TrapTester.
For commercial enquiries see Badleys.