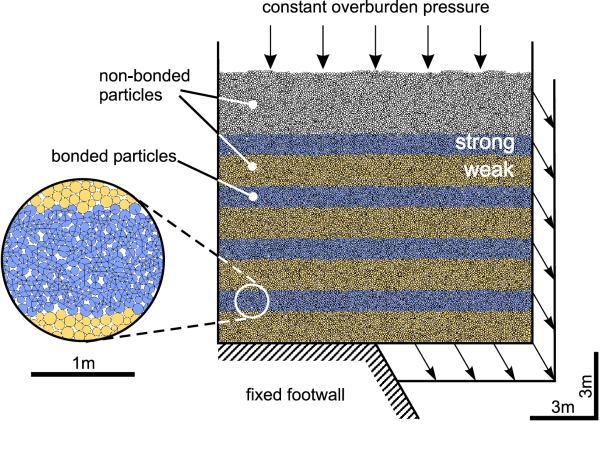
The pictures provided on this page show DEM models of normal faults propagating through a mechanical
multilayer. Not the real thing, but better than a dig in the eye!! Further details of these models are
available in Schöpfer et al. (2006, 2007a,b) - see our publication list for details.
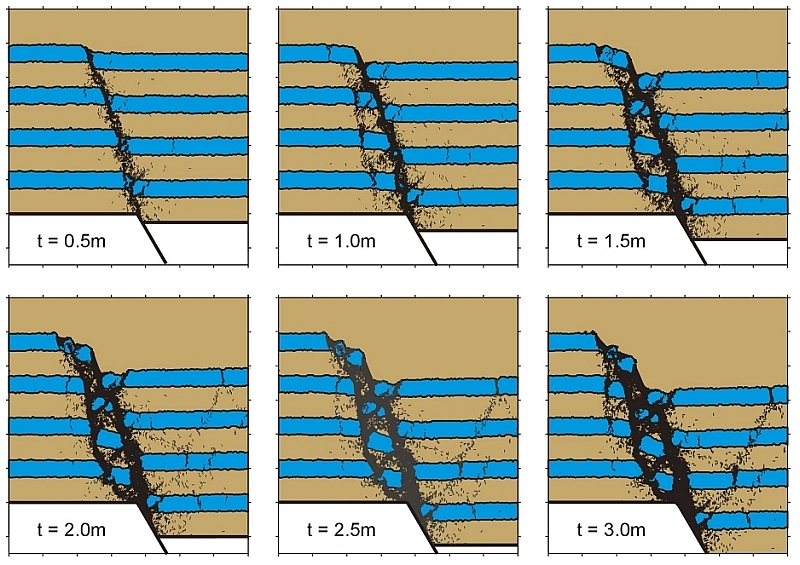
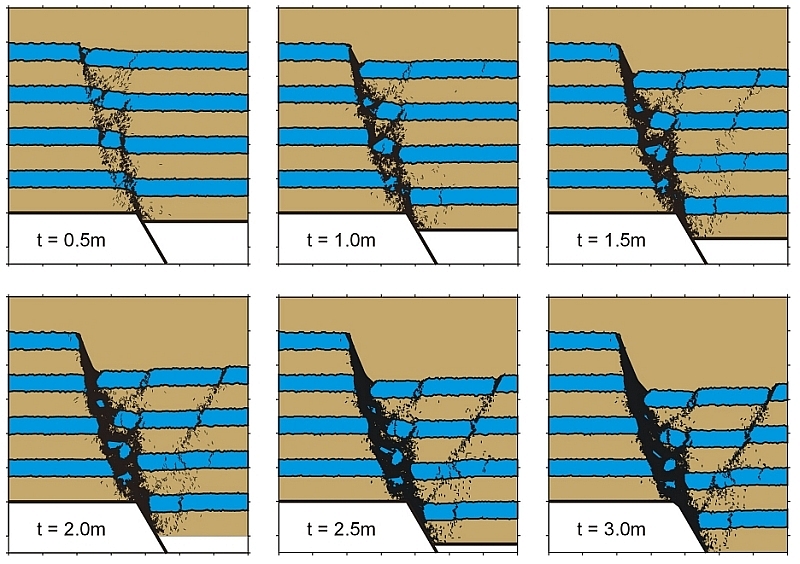
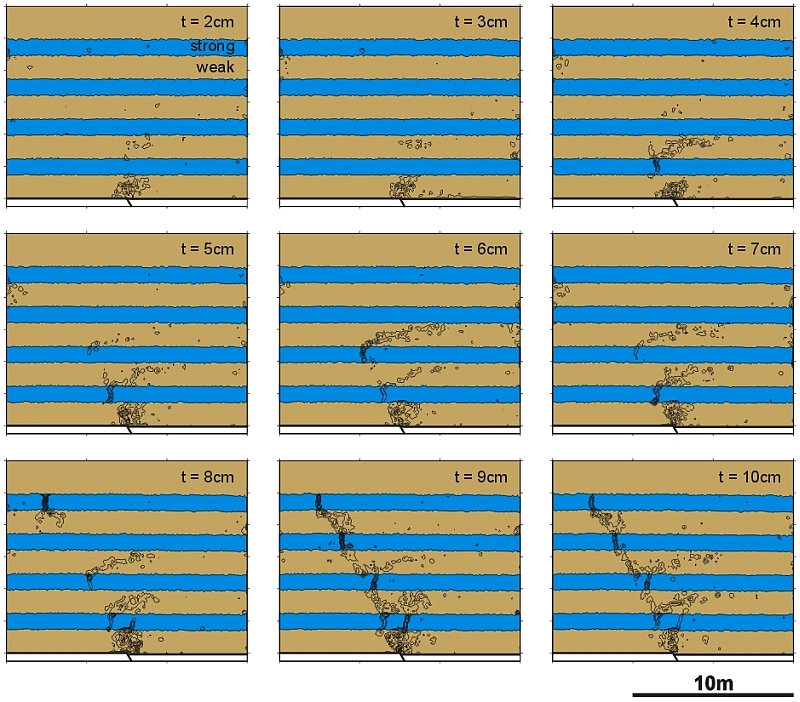
2D DEM multilayer model illustrating the formation of fault bound lenses due to:
(a) asperity bifurcation and (b) linkage of overstepping fault segments. Blue and
brown layers consist of bonded and non-bonded particles, respectively, and t = throw.
Average unconfined compressive strength of the strong layers is 128 MPa and confining
pressure is 46 MPa (equivalent to ca 2km depth for lithostatic conditions and an overburden
density of 2500 kg m-3). Black lines are particle separations greater than 1 cm. The only
difference between the two models is the initial arrangment of particles and bonds.
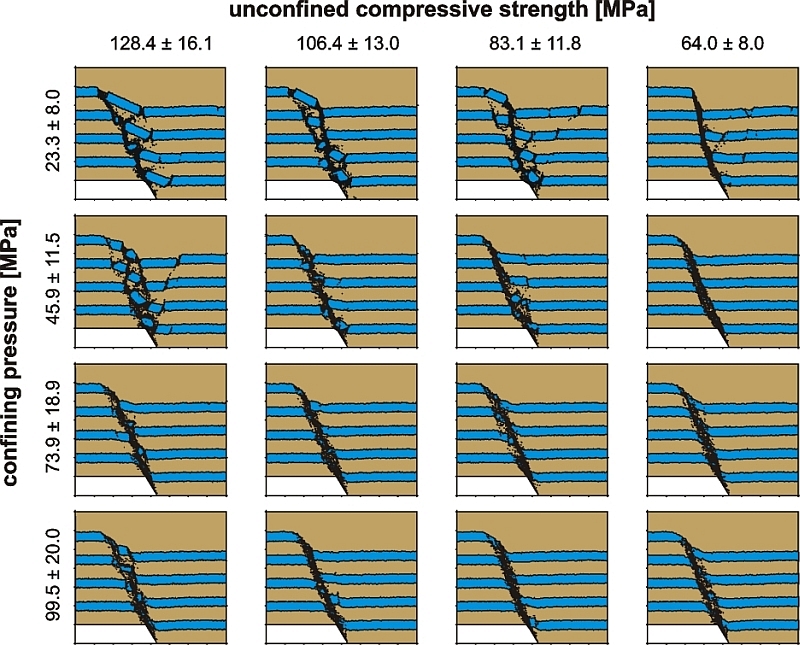
2D DEM multilayer models of faulting in periodically layered sequences. The blue layers
consist of initially bonded particles. The unconfined compressive strength of the strong
layers decreases towards the right hand side of the diagram. The brown layers consist of
non-bonded particles. The confining pressure (depth of faulting) increases towards the
bottom of the diagram. Black lines are particle separations greater than 1 cm and fault throw is 2 m.
Faults become less segmented with increasing depth of faulting and decreasing
strength contrast.
2D DEM multilayer model of normal fault growth (t = throw) showing incremental maximum shear strain contours (contour interval is 0.005).