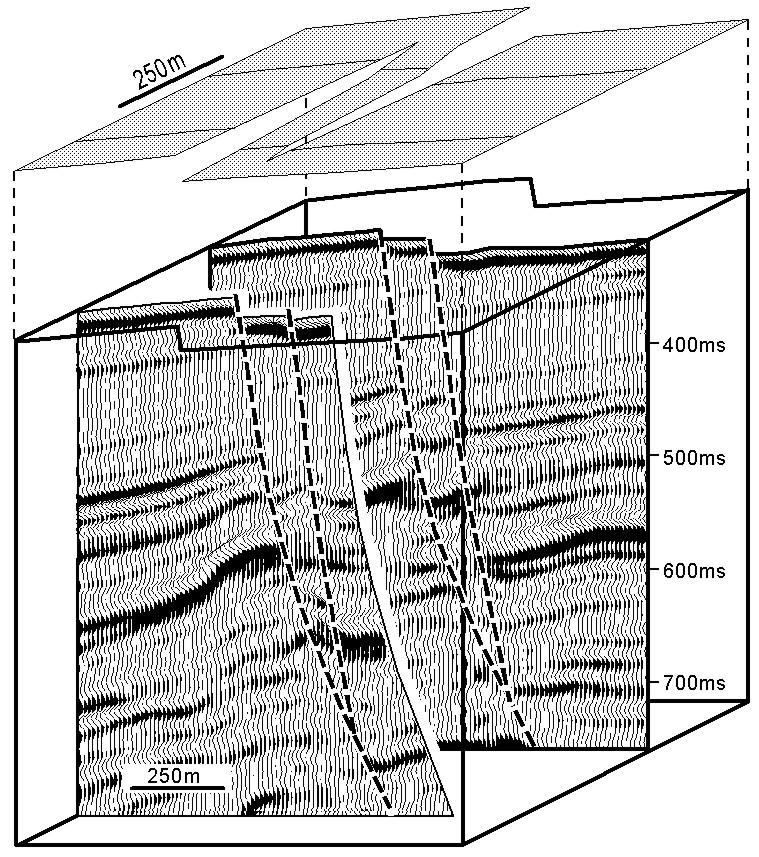
Relay from the Timor Sea. Two seismic sections across two subparallel normal faults (heavy broken lines), from the Timor Sea. The faults link downwards along a sub-horizontal branch-line. The top of each seismic section is cropped along a strong reflection and the shaded surface at the top of the diagram shows the map pattern of this reflection. Breaks in the shaded surface indicate fault offsets of the reflection and thin lines on the surface show the traces of the two seismic lines. Total fault displacements of 20ms at the mapped reflection increase downwards to 80ms on the strong reflection at 600ms TWT. Displacement is transferred between the two faults across a relay zone. The average seismic velocity is ca 2.5kms-1 and vertical exaggeration is ca 2.5.

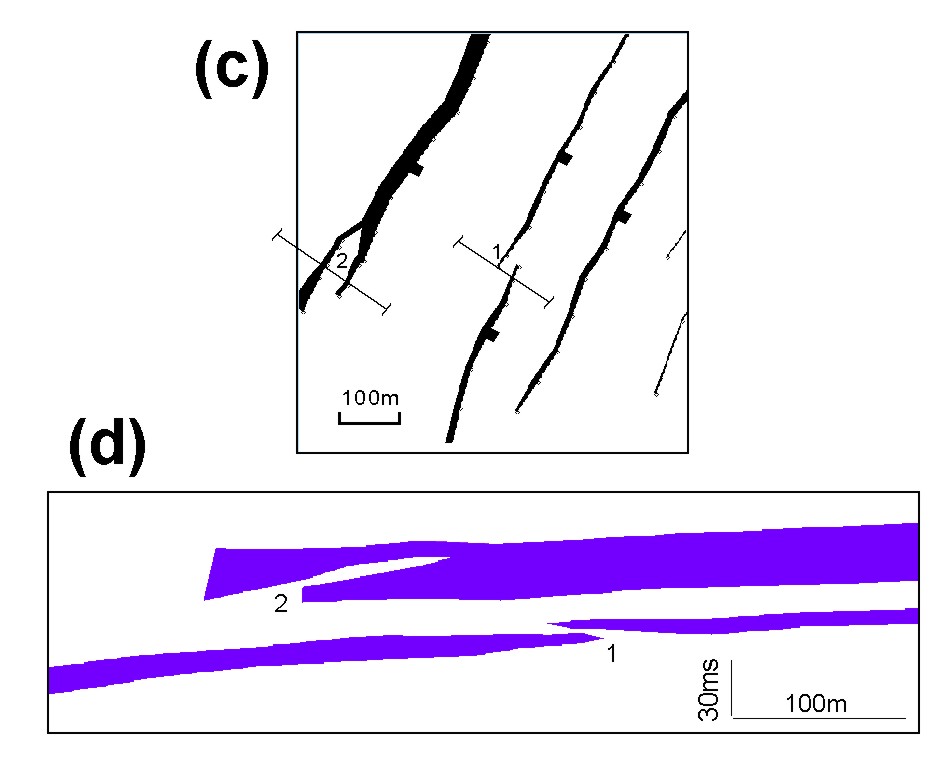
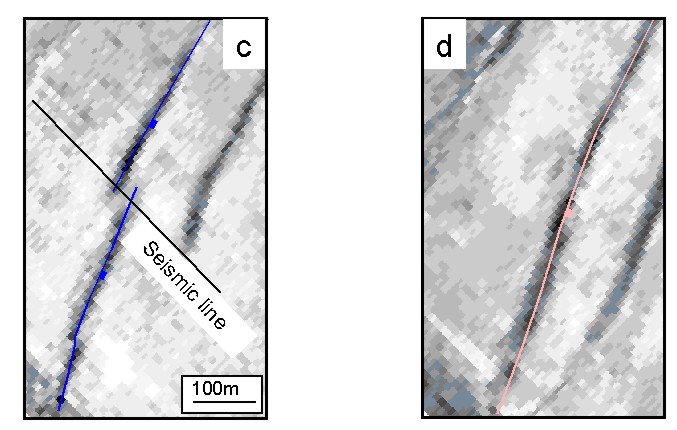
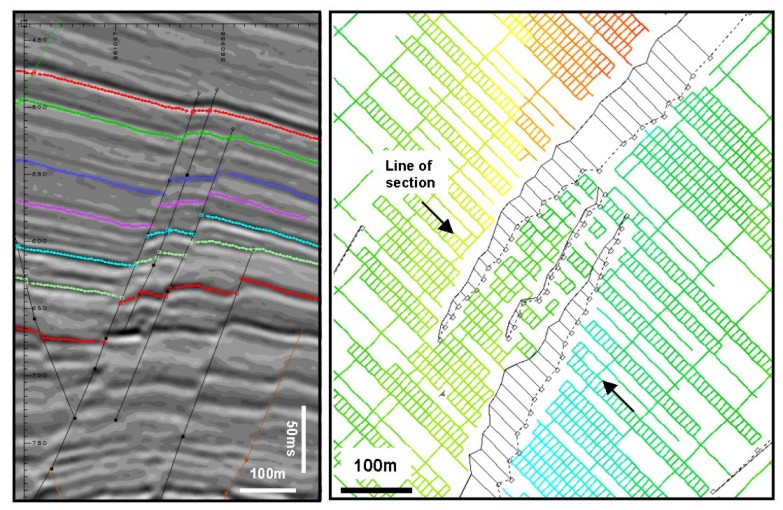
The geometry of two relays on synsedimentary normal faults from a high quality seismic dataset from SE Asia. Seismic sections (a&b) across the relays show that in each case the relay bounding fault segments rejoin at depth to form a single fault: section locations are shown in (b). A fault map (c) illustrates that Relay 1 is an intact relay, whilst Relay 2 has been breached. This view is reinforced on a horizon separation diagram (d), for the purple horizon shown on seismic sections, which shows an intact ramp for Relay 1 and a breached ramp for Relay 2: horizon separations are coloured between the footwall (upper) and hangingwall (lower) cutoffs of each fault segment.
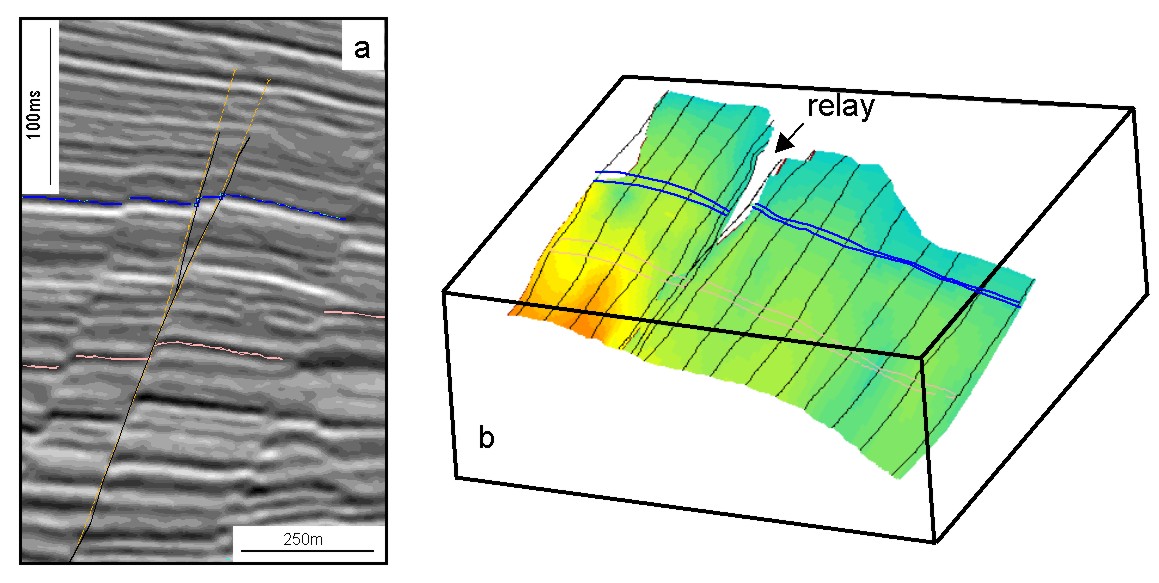
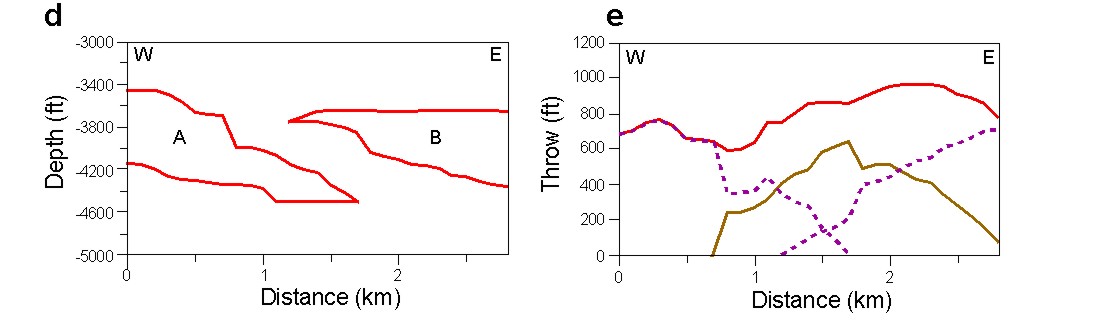
Relay formed by fault bifurcation (splaying) of a small throw synsedimentary normal fault (15m) from SE Asia. The fault shown in a seismic line (a), in fault trace continuity maps (c & d) and as a surface in a volume (b) splays upwards from a single surface on one horizon (salmon pink) to a segmented fault (with a relay) on a higher (dark blue) horizon. The 3D diagram shows the fault surface colour contoured for displacement.
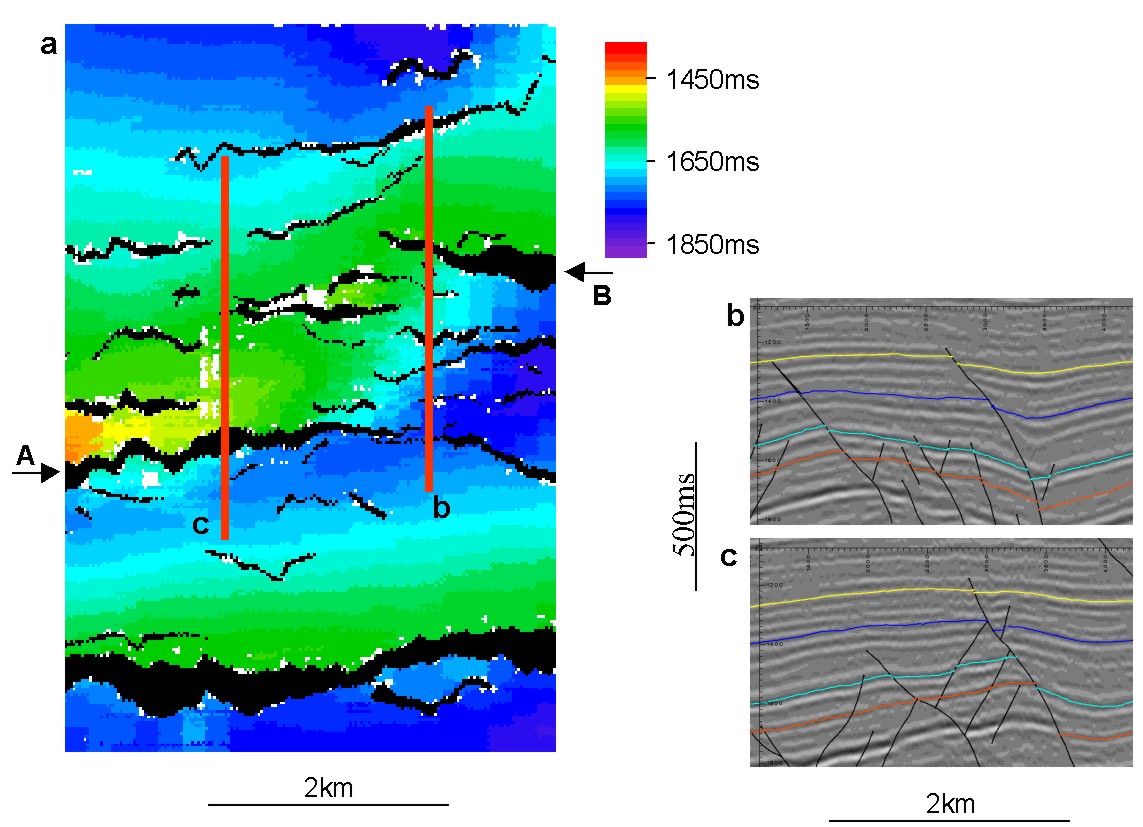
Relationships between fault displacements and relay ramp rotation for relaying faults imaged in a 3-D seismic dataset in the North Sea (d and e from Walsh et al. 1996). (a) Horizon map showing the geometry of the relay (main faults marked by arrows) and the locations of seismic sections (b) and (c). (b) Seismic line across the relay, showing significant bed rotation towards the mutual hangingwall of the fault segments, and (c) seismic line outside the relay. (d) Horizon separation diagram for faults A and B. (e) Throw profiles for faults (dashed lines), ramp rotation (solid black line) and faults plus ramp rotation (solid red line). The sum of the fault throw and rotation produces a profile which is more regular than those of the individual components, suggesting that the relay (i.e. ramp and faults) is a kinematically coherent structure.
Detailed mapping of a relay zone along a ca. 70 m maximum displacement synsedimentary fault in South-east Asia. Map and section show the rotation of beds within the relay ramp and presence of a minor, breaching fault. (b) Horizon separation diagrams, in 2D and 3D, demonstrating that displacement is transferred between the relay bounding faults by bed rotation and offset along the minor fault. The same horizon colours are are used for both the seismic section and the horizon separation diagram - only a selection of the horizons are shown on the latter.