Matlab script for visualising structure contours
The purpose of these Matlab (Mathworks Inc.) scripts is to help undergraduate students
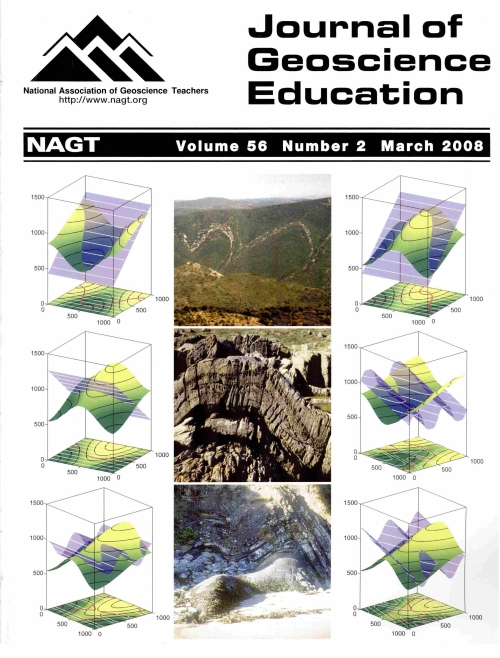
understand and visualise the concept of structure contours. Earth Science lecturers can also use the scripts for generating
diagrams for their introductory courses - Matlab graphics are easily generated and saved in a convenient format, such as
JPEG, GIF or TIF. The scripts are available for free and you are welcome to modify them (some suggestions are given below).
More complete descriptions of the scripts are given in the paper Schöpfer, M.P.J. 2008. A Matlab script for visualizing structure contours and outcrop patterns in three dimensions. Journal of Geoscience Education 56, 142-148., which can be downloaded on the NAGT website. Myself and John Walsh have successfully used these scripts and their
graphical output in our courses at UCD (1st and 2nd year Geology, 3rd year Civil Engineering) and we hope that they will prove
to be useful in other universities too. This webpage also contains photos and images of a number of related geologic structures
- please acknowledge their source if you use them for teaching or other purposes.
If you have any suggestions or if you have modified the script in a useful way please let me know and I will try to add your script
(with due credit) to the list of suggested modifications given below - but remember, keep it simple! Unfortunately I cannot always
reply to technical (i.e. Matlab) related problems. Good luck and happy structure contouring!!
Martin Schöpfer
Email: martin@fag.ucd.ie
|
Content
The following pages provide an introduction to the concepts underpinning structure contours
and a description of Matlab scripts for their visualisation. The scripts themselves are also
provided - please feel free to copy them and put them to good use!
These teaching resources, i.e. webpages and computer programs,
are obviously not a substitute for lectures, practicals and field classes. Nevertheless, I hope that the
accompanying images and scripts represent a useful complement to other course material, in your
efforts to better teach or understand structure contours.
Introduction
Outcrop photos
Matlab script for plotting planar and simple folded layers
Suggested modifications of Matlab script
Matlab scripts for download
Pictures generated with script for download
Just in case you do not have Matlab. Here I provide a number of high-resolution TIFF files of pictures generated with the Matlab script.
Each link is associated with a certain geometry and directs you to a ZIP file that contains a number of files.
- Plane, dipping 20 degrees, in valley (8 files, 3.9 MB)
- Plane, dipping 40 degrees, in valley (8 files, 3.9 MB)
- Plane, dipping 20 degrees, across ridge (8 files, 3.9 MB)
- Plane, dipping 40 degrees, across ridge (8 files, 3.9 MB)
- Plane, dipping 20 degrees, in two valleys (8 files, 4.2 MB)
- Plane, dipping 40 degrees, in two valleys (8 files, 4.3 MB)
- Sinusoidal Folds (12 files, 5.5 MB)
- Chevron Folds (12 files, 12.4 MB)
- Box Folds (12 files, 12.5 MB)
- Parasitic Folds (12 files, 12.5 MB)
________________________________________________________________
Last update: February 2009
Check out links on our website for Educational Material and photo Gallery.
|