How to run the script
First copy all the m-files provided to a folder and then launch Matlab and open the script 'SUPERPOSED_FOLD_PAPERMODEL.m'. Then run the script by selecting 'Run' in the 'Debug' menu, or by using the shortcut F5. You might get a message that the file is not found in the current directory. Select 'Change Matlab current directory' and click OK. Then the following Menu appears: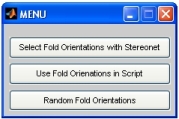
If you use the first option you can select the first and refold fold orientations by clicking with the mouse on a stereonet (see below). If you use the second option then the fold orientations listed in the script are used. Alternatively you can 'ask the computer' to randomly choose fold orientations for you. If you select either the second or the third option then a stereonet plot with the fold orientation data (quoting dip direction/dip and plunge direction/plunge) is shown. If you select the first option then a blank stereonet appears.
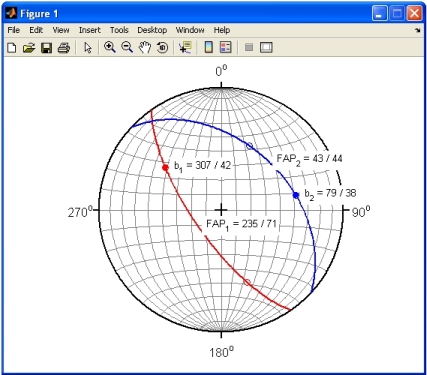
In case you want to select the fold orientations with the mouse then click on the stereonet (crosslines help you to precisely pick the orientation data). The first mouse-click provides the orientation of the first fold axis (b1; red filled circle). The second mouse click is used to define the fold axial plane of the first fold (FAP1). Remember that a plane can be defined by two non-parallel lines and that the fold axis is contained within the fold axial plane. The second point (open red circle) therefore represents one of an infinite number of lines that is contained within the plane. The refold fold orientation (blue) is generated using the same steps, first select the fold axis (b2), then another line that is contained within the fold axial plane (FAP2).
Then the following menu appears:
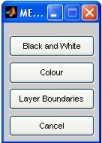
If you have a black and white printer only or if you want to photocopy the papermodel then you might want to use the black and white option. If you have a colour printer then select the colour option. Alternatively you might want to colour the layers yourself using colour pencils/crayons (this might be a good exercise for undergrads) and plot the layer boundaries only. If however you are not satisfied with your own selection, or with the orientation data randomly selected by the computer, you can cancel and start again. If you selected one of the first three options then a figure with a papermodel, like the one shown below, appears. How fast the papermodel figure appears depends on the model resolution (see below) and on the speed of your computer (it typically takes about a minute to calculate a print quality model).
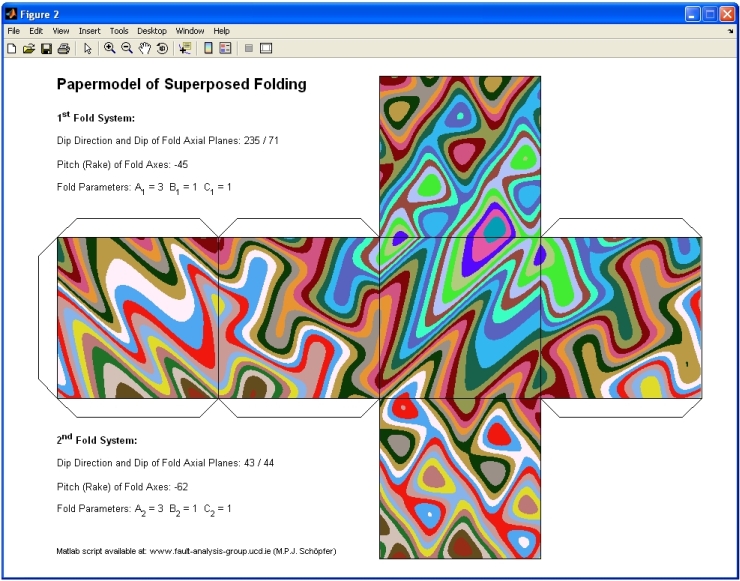
Finally a menu appears that gives you the option of saving the model as an PNG file.
If you select 'Yes' then the model is saved using the fold orientation data as a filename. For the example shown above the filename would be: Superposed_Papermodel_F1_235_71_-45_F2_43_44_-62_col.png
How to modify the script
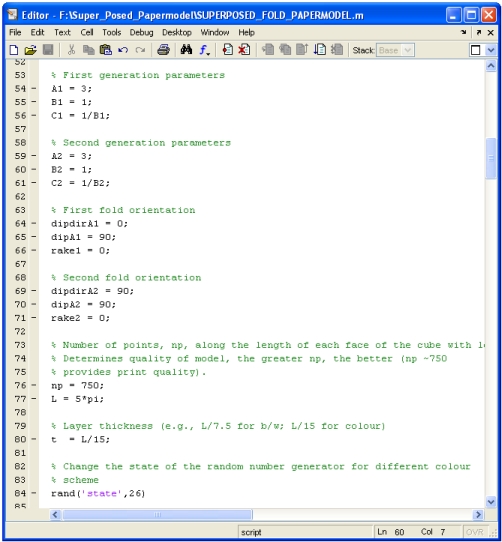
By default the fold parameters A, B and C of both fold generations are 3.0, 1.0 and 1.0, the resolution of each papermodel face is provided by a 750 × 750 squares grid, the side length L of each face is 5π and the layer thicknesses are L/15. You are welcome to change these parameters but the script does not check whether the input values are sensible or not!You can also reduce the quality of the papermodel by, for example, setting np = 100. Models which are not generated at print quality can be produced rapidly, therefore providing a means of familiarising yourself with the usage of the script and quickly exploring the impact of various parameters on interference pattern geometry.
In addition to the parameters already mentioned above the colour scheme can be altered by changing the state of the number generator, e.g. rand('state', 25) will produce a different random colour pattern than rand('state', 26), which is what I used for all the papermodels on this webpage.
The Matlab Editor window that shows the set of parameters that can be changed is shown below.